
Tổng hợp bài mẫu IELTS Writing Task 1 - Band 9 theo từng dạng bài
3.1. Biểu đồ đường (Line graph)
Dạng biểu đồ đường thường được dùng để thể hiện sự biến đổi của các thông số theo thời gian. Dưới đây là một vài bí quyết giúp bạn trình bày bài viết này dễ dàng hơn:
Bạn không cần đưa ra những con số trong phần tóm tắt mà chỉ nên đề cập đến những số liệu chung và nổi bật nhất: Overall change, highest and lowest …
Không mô tả từng đường số liệu riêng biệt, hãy đưa ra sự so sánh giữa các đường.
Hạn chế sử dụng các thể bị động (the number was increased), thì hiện tại tiếp diễn (the number was increasing), hoặc quá khứ hoàn thành (the number has increased).
Đề bài mẫu: The graph below gives information about the percentage of the population in four Asian countries living in cities from 1970 to 2020, with predictions for 2030 and 2040.
Summarize the information by selecting and reporting the main features and making comparisons where relevant.
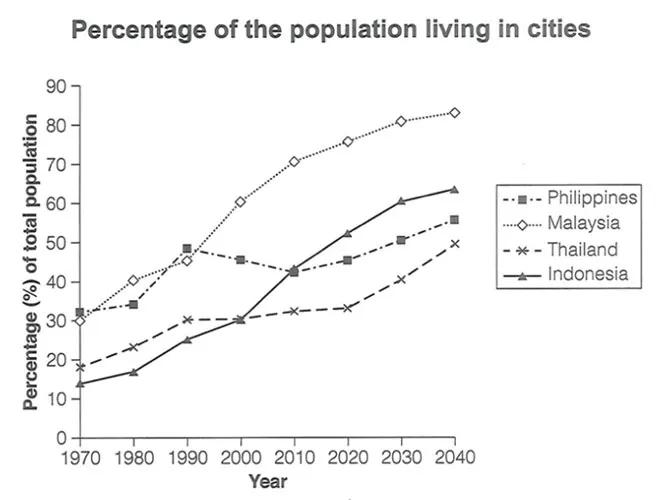
The line chart shows how urban residency has changed in four Asian countries from 1970 to 2040. Overall, it is clear that urban living will increase in all countries, especially in Malaysia and the Philippines. By 2040, Malaysia will have the highest percentage of people living in cities.
In 1970, the Philippines and Malaysia had similar urban residency rates, around 31% and 30% respectively. Thailand and Indonesia had lower rates, with Thailand at 19% and Indonesia at 12%. Over the next 20 years, Malaysia’s rate went up and down, surpassing the Philippines around 40% before rapidly increasing in 1990. It is projected to reach over 80% by 2040. On the other hand, the Philippines saw a moderate decline after 1980 but is expected to recover and reach above 50% by 2040.
Indonesia has seen significant growth in urban residency, surpassing Thailand in 2000 (28%) and the Philippines in 2010 (42%). It is projected to reach 55%, the second-highest among all countries. Finally, Thailand has experienced a gradual increase and is currently around 30%. It is expected to rise to over 40% in the next 17 years. (186 words)
Xem thêm: Cách viết IELTS Writing Task 1 dạng line graph (biểu đồ đường)
3.2. Biểu đồ cột (Bar chart)
Dưới đây là một vài bí quyết giúp bạn dễ dàng ghi điểm ghi gặp dạng biểu đồ cột:
Mô tả dữ liệu số từ trái sang phải đề cập đến sự thay đổi của biểu đồ
Lưu ý các sự kiện chính và ảnh hưởng của chúng lên các số liệu qua từng thời kỳ
Hãy nêu chi tiết và dẫn chứng những số liệu trong đoạn văn của bạn
Liên kết câu với các từ như: while, compared to, along with, whereas, etc.
Đề bài mẫu: The chart below shows the expenditure of two countries on consumer goods in 2010.
Write at least 150 words. You may spend 20 minutes to complete the task.
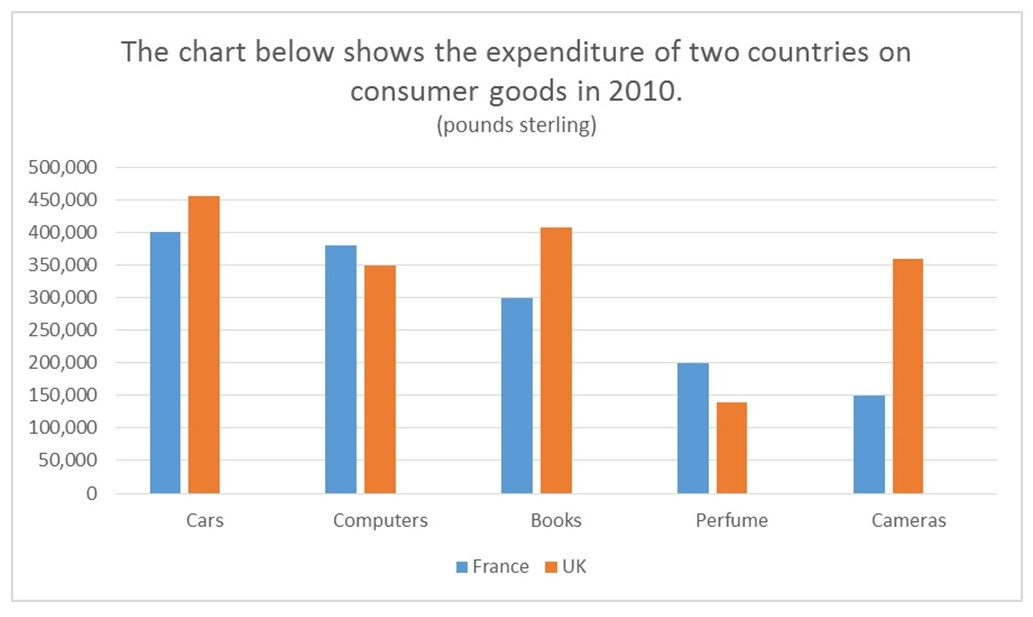
The bar chart provides information on five different areas of expenditure in the UK and France in 2010.
Relatively more money was spent by the UK on cars, books and cameras than France. On the former category, the UK spent just over 450,000 pounds, whereas France used about 55,000 pounds less. For books, the expenditure gap widened, but both countries expended less than they did on cars: approximately 400,000 and 300,000 pounds for the UK and France, respectively. The margin in spending was the largest for cameras, with the figure for France being more than two times smaller (150,000 pounds) than that for the UK (slightly over 350,000 pounds).
However, France’s expense on computers and perfume was higher than the UK’s. About 380,000 pounds was spent by France on computers as opposed to 350,000 pounds by the UK, but the amounts for perfume were a lot lower with the respective figures of 200,000 and just under 150,000 pounds.
Overall, the UK spent more money on cars, books and cameras, whereas France did so on the other two categories: computers and perfume. It is also apparent that both these nations used the most money on automobiles, and the biggest difference in expenditure was recorded in cameras. (205 words)
Xem thêm: Cách viết Writing Task 1 dạng Bar chart chỉ với 3 bước cực hiệu quả
3.3. Biểu đồ tròn (Pie chart)
Đối với biểu đồ tròn, bạn nên:
Chú ý đến khung thời gian của biểu đồ để sử dụng thì, ngữ cảnh thích hợp.
Tránh đưa ra ý kiến cá nhân. (Ví dụ: Nếu một biểu đồ thể hiện sự tăng giá và cho dù bạn biết đó là kết quả bởi chiến tranh ở Trung Đông, bạn cũng không nên đề cập đến quan điểm cá nhân của mình.
Đề bài mẫu: The pie chart gives information on the proportion of carbohydrates, protein and fat in three different diets.
Write a report for a university lecturer describing the information shown below. Make comparisons where relevant. You should write at least 150 words.
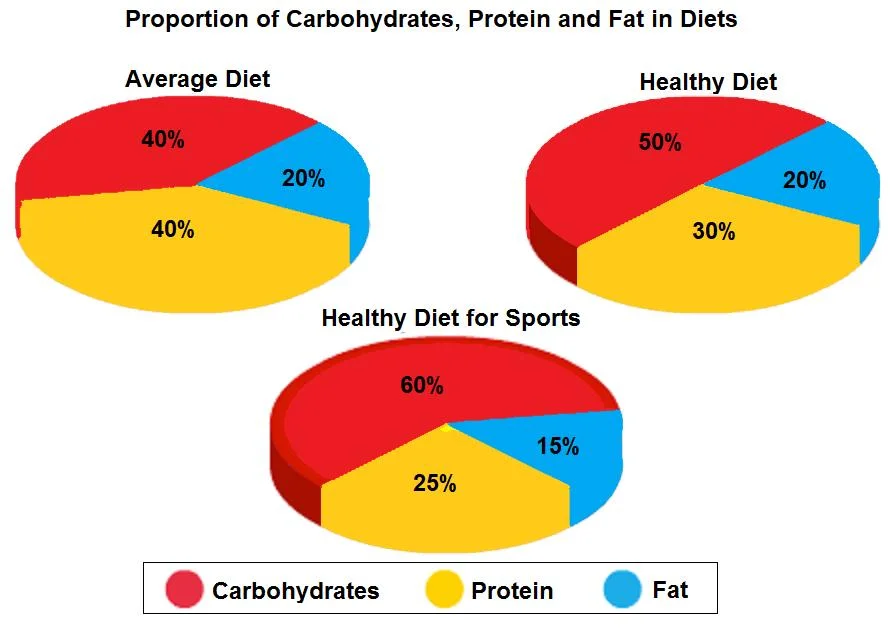
The pie charts compare the proportion of three main macronutrients in separate diets, namely an average diet, a healthy diet and a healthy diet for sport.
In general, carbohydrates are the highest nutritional ingredient overall, whereas the rate of fat is the lowest among given diets. It is noticeable that a healthy diet for sports consumes the highest amount of carbs but the lowest amount of fat compared to the two remaining diets.
Sport players select a healthy diet with 60% of carbohydrates. The percentages of carbohydrates in a healthy diet and an average diet are relatively lower, at 50% and 40% respectively. By contrast, fat consumption remains lowest in all healthy diets for people playing sports (15%), while the figures for an average diet and a healthy diet are equal (20%).
In terms of protein, average diet eaters require the highest level, at 40%. This is 10% higher than the proportion of protein in a healthy diet, and 15% more than the proportion in a healthy diet for sport.
(170 words)
Xem thêm: Cách viết dạng Pie Chart trong Writing Task 1 chi tiết nhất
Đăng Ký Thi IELTS Trên Giấy Ngay
3.4. Bảng số liệu (Table)
Bảng số liệu sẽ là một thử thách khi chúng chứa quá nhiều số liệu liên quan đến nhiều khía cạnh khác nhau. Vậy nên đây là một số lời khuyên cho bạn:
Mô tả/ so sánh các keys mà bạn đã tô sáng - bao gồm ít nhất 3 số liệu trong mỗi đoạn.
Sử dụng thì quá khứ đơn cho những năm trước và 'will' hoặc 'is expected/predicted to' cho những năm sau. Nếu không có khoảng thời gian thì sử dụng hiện tại đơn.
Đối với đoạn tóm tắt, hãy thử so sánh toàn bộ các phần (cột hoặc hàng) thay vì từng ô riêng lẻ trong bảng. Nếu bạn không thể so sánh toàn bộ danh mục, hãy so sánh số lớn nhất và số nhỏ nhất.
Đề bài mẫu: The table with the percentage of students in six different departments in 2011.
Summarize the information by selecting and reporting the main features, and make comparisons where relevant. Write at least 150 words.
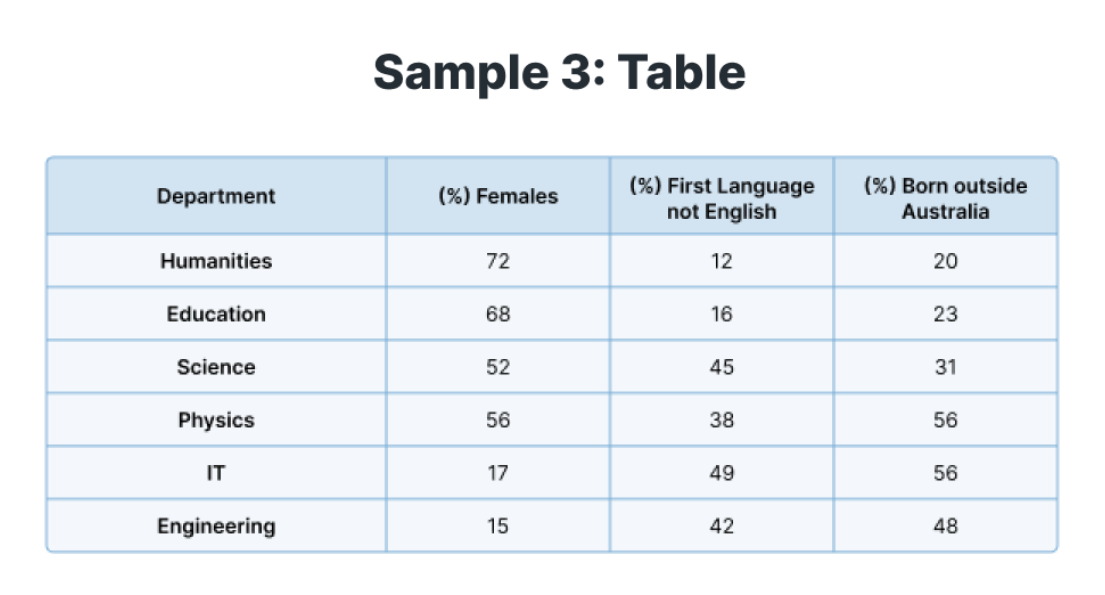
The given table illustrates data on different aspects of undergraduates who took six different majors at an Australian University in 2011.
Overall, while the social science departments attracted the majority of female students, there were a large number of undergraduates who preferred learning IT and engineering at university.
Specifically, most females were in favor of humanities majors (72%) and the educational sector (68%). While there were slightly more than half of this population studied Science and Physics (52% and 56%, respectively), they seemed less appealing to technological majors such as information technology and engineering which accounted for roughly 15%.
It is also clear that the proportion of non-native English speakers and overseas undergraduates took the leading position in science and technology majors. In particular, approximately half of students whose first language was not English enrolled in the IT department, which was followed by science (45%) and engineering (42%) majors. Whereas the physics department experienced 38% of enrolment of this group, humanities and pedagogy attracted nearly 15% of undergraduates.
The same pattern can be observed in the percentage of students born in other foreign countries. The physics and IT departments had the highest percentage of enrolment (56%), and engineering held second place with 48%. Other departments were listed in decreasing order as follows: science, education, and humanities, with 31%, 23%, and 20% respectively.
Xem thêm: Cách viết Writing Task 1 dạng Table bám sát tiêu chí chấm bài
3.5. Biểu đồ Quy trình (Process)
Dạng bài Process cung cấp một sơ đồ quy trình cho thấy các bước hay giai đoạn để thực hiện một điều gì đó. Dưới đây là một số lời khuyên về cách mô tả bài viết này:
Phần tóm tắt, bạn cần chỉ ra có bao nhiêu bước trong quy trình. Sau đó, nói về nơi/ quá trình bắt đầu và kết thúc (nhìn vào giai đoạn đầu tiên và cuối cùng).
Bạn có thể mô tả tất cả các bước trong một đoạn, nhưng sẽ hợp lý hơn nếu bạn chia mô tả thành hai đoạn. Chỉ cần bắt đầu đoạn 4 tại đâu đó ở giữa quy trình.
Nên đưa ra ví dụ ở dạng bị động. E.g: 'At the final stage, the product is delivered to shops' (vì chúng tôi không cần biết ai đã giao sản phẩm).
Đề bài mẫu: The diagram below shows how the Australian Bureau of Meteorology collects up-to-the-minute information on the weather in order to produce reliable forecasts.
Write a report for a university lecturer describing the information shown below. Write at least 150 words.
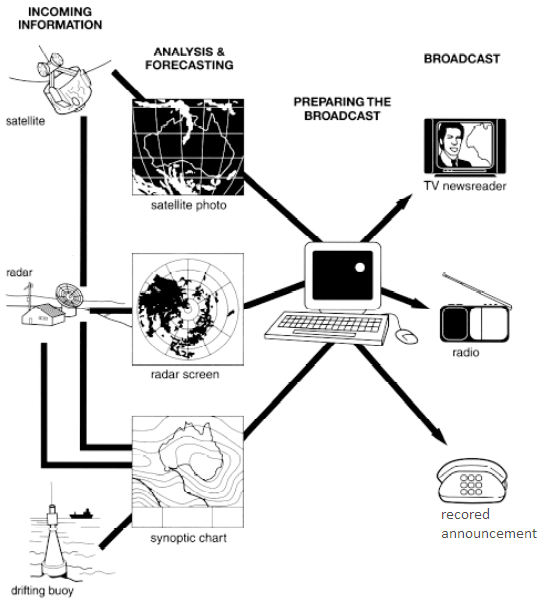
The figure illustrates the process used by the Australian Bureau of Meteorology to forecast the weather.
There are four stages in the process, beginning with the collection of information about the weather. This information is then analyzed, prepared for presentation, and finally broadcast to the public.
Looking at the first and second stages of the process, there are three ways of collecting weather data and three ways of analyzing it. Firstly, incoming information can be received by satellite and presented for analysis as a satellite photo. The same data can also be passed to a radar station and presented on a radar screen or synoptic chart. Secondly, incoming information may be collected directly by radar and analyzed on a radar screen or synoptic chart. Finally, drifting buoys also receive data which can be shown on a synoptic chart.
At the third stage of the process, the weather broadcast is prepared on computers. Finally, it is delivered to the public on television, on the radio, or as a recorded telephone announcement. (170 words)
Xem thêm: Hướng dẫn viết dạng bài Writing Task 1 Process chi tiết từ A-Z
3.6. Biểu đồ Map (Bản đồ)
Đề bài mẫu: The diagram shows how electricity is generated by a hydroelectric dam.
Write a report for a university lecturer describing the information shown below. Write at least 150 words.

The diagram illustrates the production of power through the use of a hydroelectric dam.
The process begins with water in a reservoir and ends with the transmission of power via long-distance power lines.
In order to generate hydroelectricity, the first step is to collect water in a reservoir. When power generations begins the water passes through an intake in the bottom of the dam and then enters a long tunnel called a penstock. On the other hand, when power is not being produced the intake is blocked by a large gate that prevents the flow of water. However, when the intake is opened, the water flows down the penstock and the pressure it creates is used to spin a turbine, which is connected to a generator in a place referred to as the powerhouse. At the same time, the water that has gone through the turbine flows out into the river below the dam. Finally, the generator in the powerhouse is connected to power lines which are used to transport the electricity over long distances. (175 words)
Xem thêm: Cách viết Writing Task 1 dạng Map đạt điểm cao
Tự tin ghi điểm các dạng bài trong IELTS Writing Task 1!
Với các bài tập mẫu trong phần thi IELTS Writing Task 1 ở trên, hy vọng bạn đã nắm được phần nào cấu trúc bài thi và bỏ túi được vốn từ vựng, ngữ pháp để ghi điểm thật cao trong bài làm của mình. Bạn có thể đọc thêm chiến thuật giải quyết các dạng bài ở kho tài nguyên IELTS sẵn có của IDP.
Để luyện tập thêm đối với dạng bài này, bạn có thể tham khảo kho tài liệu miễn phí bao gồm các bài viết chia sẻ phương pháp làm bài, video chia sẻ bí quyết từ chuyên gia cùng ứng dụng luyện thi IELTS by IDP, bạn có thể luyện tập tại nhà vào bất kỳ thời gian nào.
Bên cạnh đó, bạn có thể xem lịch thi IELTS IDP và đăng ký trải nghiệm thi thử tại các trung tâm khảo thí IELTS của IDP, tham gia Hội thảo sự kiện IELTS do các chuyên gia IDP trực tiếp hướng dẫn để hiểu hơn về những lỗi phổ biến cần tránh, nghiên cứu một số câu hỏi và câu trả lời mẫu cùng video hướng dẫn luyện thi từ chuyên gia.
Nếu bạn đã sẵn sàng, đăng ký thi IELTS cùng IDP tại đây!
Link nội dung: https://marketingalpha.vn/cac-dang-de-writing-task-1-a48079.html